
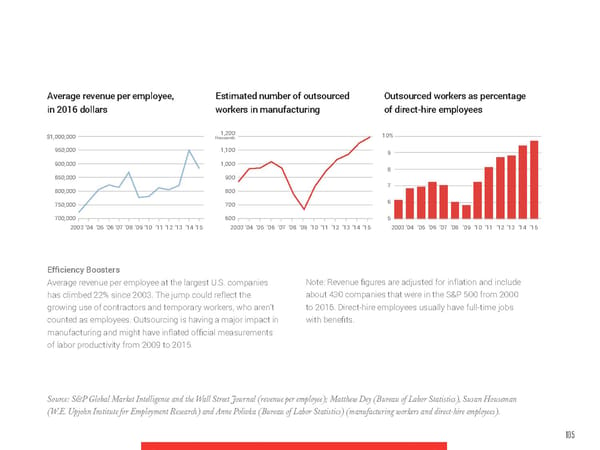
Average revenue per employee, Estimated number of outsourced Outsourced workers as percentage in 2016 dollars workers in manufacturing of direct-hire employees 1,200 10% $1,000,000 thousands 950,000 1,100 9 900,000 1,000 8 850,000 900 800,000 800 7 750,000 700 6 700,000 600 5 2003 ’04 ’05 ’06 ’07 ’08 ’09 ’10 ’11 ’12 ’13 ’14 ’15 2003’04 ’05 ’06 ’07 ’08 ’09 ’10 ’11 ’12 ’13 ’14 ’15 2003’04 ’05 ’06 ’07 ’08 ’09 ’10 ’11 ’12 ’13 ’14 ’15 Efficiency Boosters Average revenue per employee at the largest U.S. companies Note: Revenue figures are adjusted for inflation and include has climbed 22% since 2003. The jump could reflect the about 430 companies that were in the S&P 500 from 2000 growing use of contractors and temporary workers, who aren’t to 2016. Direct-hire employees usually have full-time jobs counted as employees. Outsourcing is having a major impact in with benefits. manufacturing and might have inflated official measurements of labor productivity from 2009 to 2015. Source: S&P Global Market Intelligence and the Wall Street Journal (revenue per employee); Matthew Dey (Bureau of Labor Statistics), Susan Houseman (W.E. Upjohn Institute for Employment Research) and Anne Polivka (Bureau of Labor Statistics) (manufacturing workers and direct-hire employees). 105
 Future of Work, Think Series Page 98 Page 100